
Mastery Gradebook
Photo by NeONBRAND
The Business Problem
School districts are increasingly moving away from traditional A,B,C grades and towards a method of grading that focuses on a student’s mastery of different skills and concepts. Our current solution was not robust enough to meet the needs of the increasingly growing and vocal group of schools practicing standards-based grading. Additionally, the technical architecture of our previous solution would not hold up to the complexity we would need to add to make an impact in the market
My Role
Lead Designer. Responsible for everything from research to design delivery.

Initial Research & Synthesis
I joined this project and immediately led the synthesis of the 12 user interviews the Product Managers had conducted about their needs around standards-based grading and mastery.
The summary of findings from the research synthesis
Key Research Insights
1
Teachers want to be able to see how their students are doing at a high level to be able to help the students who are struggling or not doing their work.
2
The process of adding learning objectives to anything in Schoology is cumbersome, complex, and takes too long. This prevents teachers from using them at all in Schoology.
3
Teachers and Admins want to be able to find trends for individuals and classes to learn what is working, what's not, and why. This can help inform future instruction.
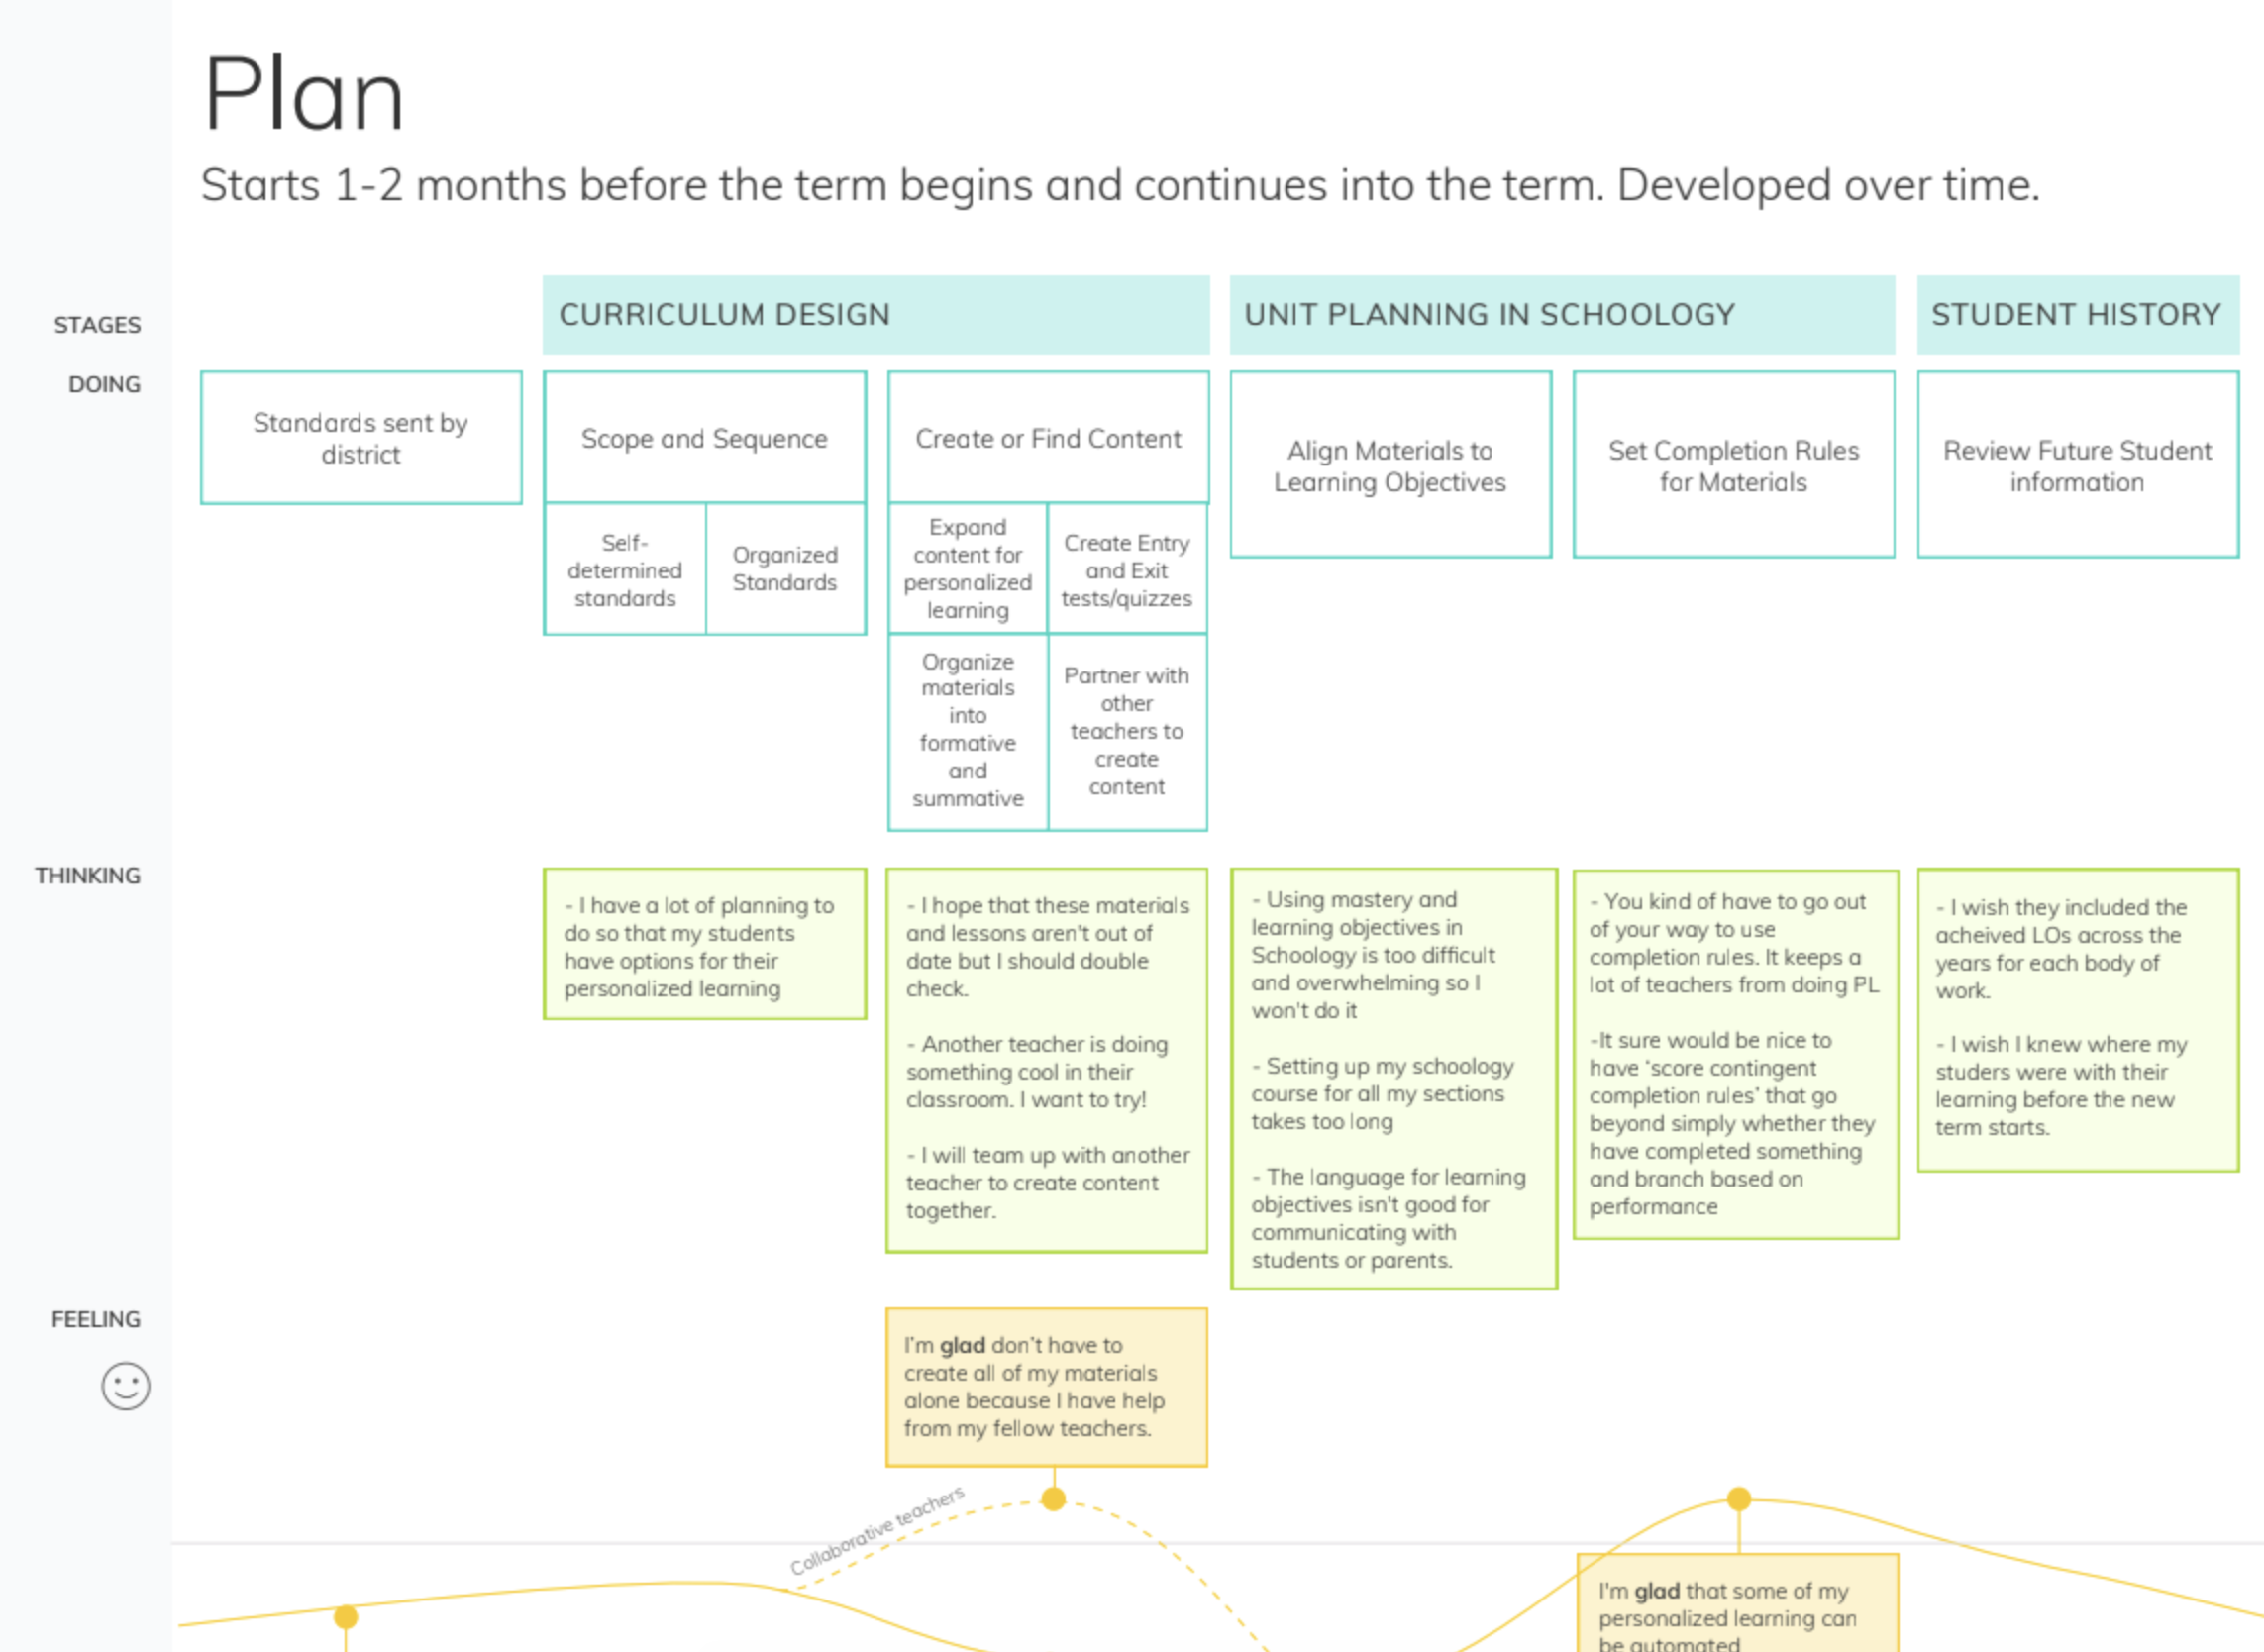
Journey Map Workshop
From our interviews and conversations with internal subject matter experts we were able to create a journey map of a teachers and admin’s journey through the lens of standards-based grading and personalized learning.


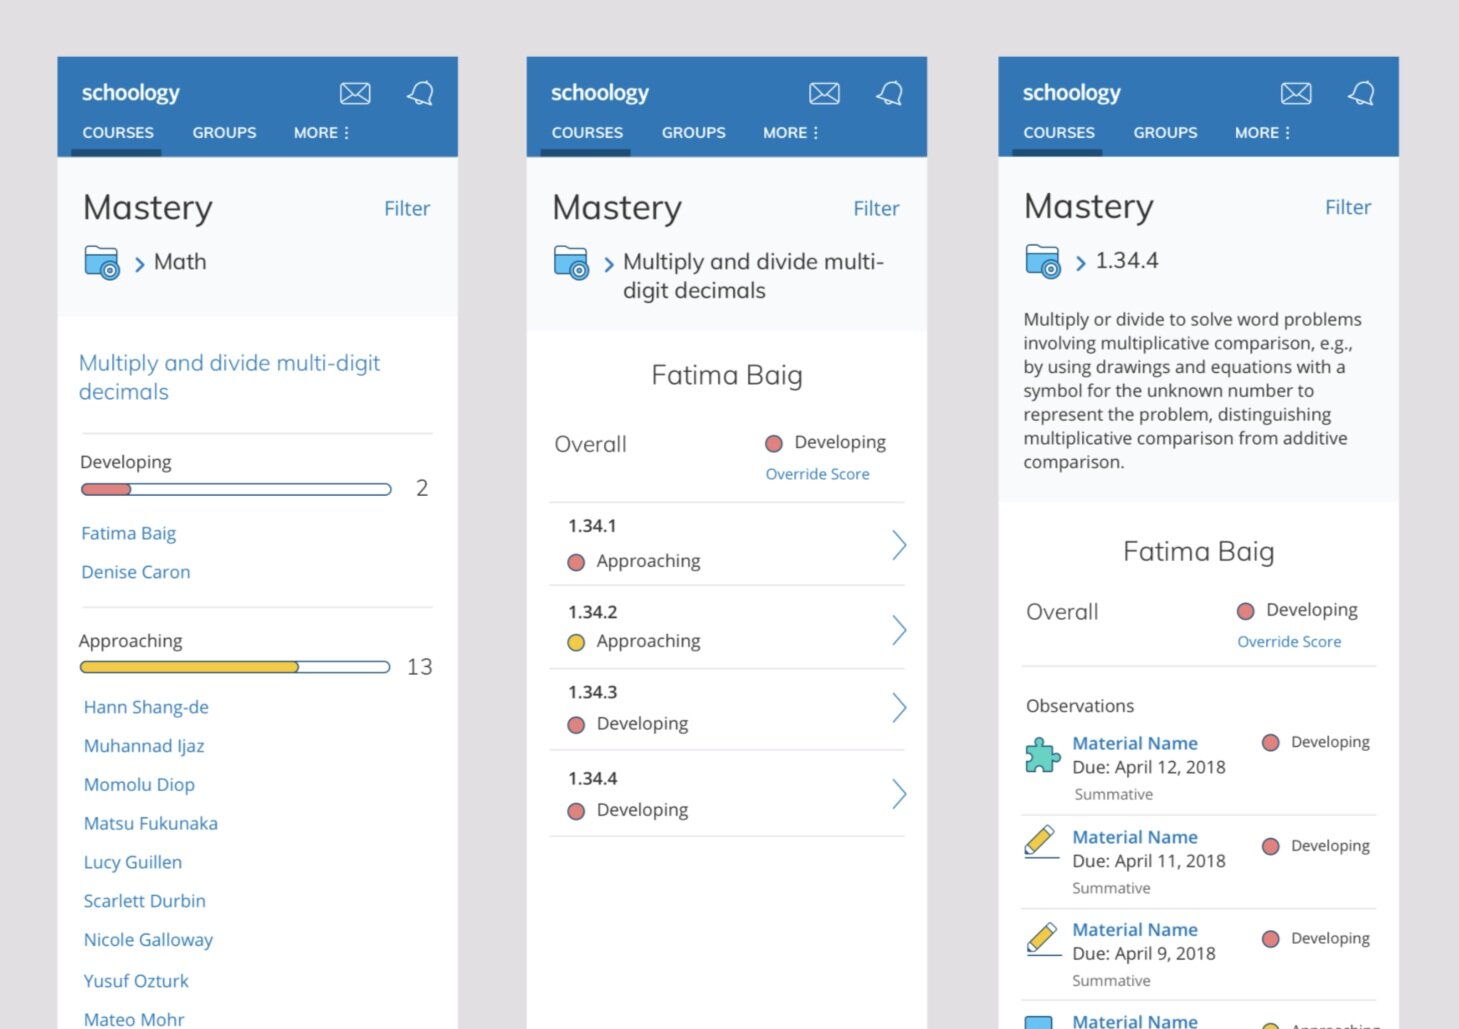
Rapid Iteration & Testing
I set myself up for an ambitious weekly testing and iteration cycle for this project in order to move at the speed we needed to reach our goal of a coded front end in production by January 2019. Each week for 6 weeks I recruited and held user sessions to get answers to our lingering questions as well as test the newest design.
Examples of the design iterations I tested


Key Research Insights

1
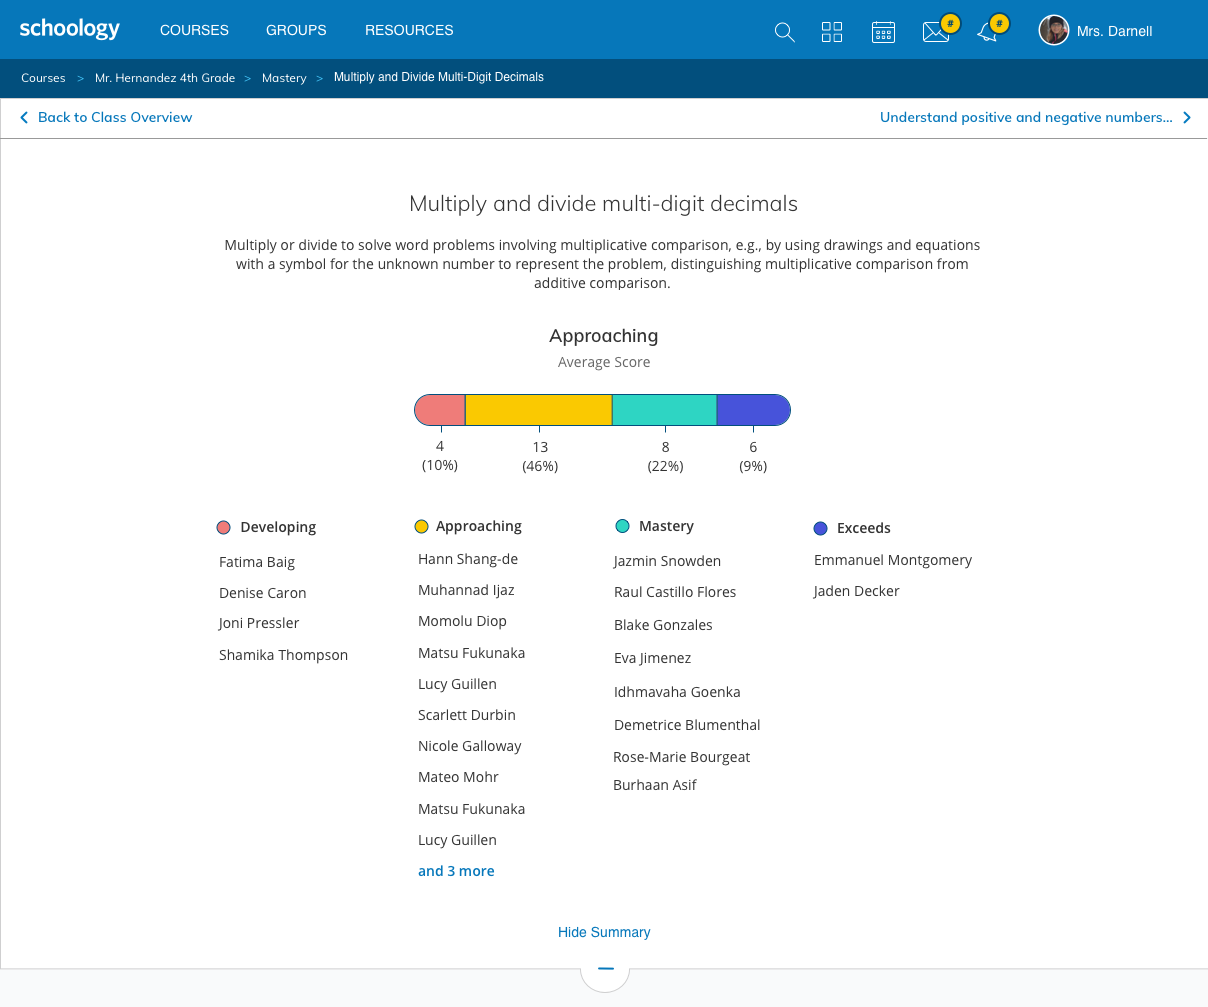
Teachers want to use mastery data to place students into groups for more focused instruction on particular topics. This type of view was particularly exciting for teachers. They wanted to use this to create balanced student groups

2
While I hypothesized that full color cells would be overwhelming, I learned through concept tests that colorful heat-maps help teachers to get a better sense of the class’s progress. The more minimal design shown here made it harder for teachers to gauge their class’s understanding.
MVP Design


A video of the MVP in action after development.
Business Impact
Increased demo requests by 450% - the most of any Schoology email marketing campaign
Exceeded pilot goal of 30 school districts using the Mastery-Based Gradebook by 250% within 2 months of release